JavaFX BarChart and StackedBarChart Tutorial with Examples
1. JavaFX BarChart
JavaFX BarChart is used to draw out a bar chart, which is a two-dimensional one with 2 axis X and Y. In this chart, one axis denotes a group of interested objects, and the other denotes numeric data.
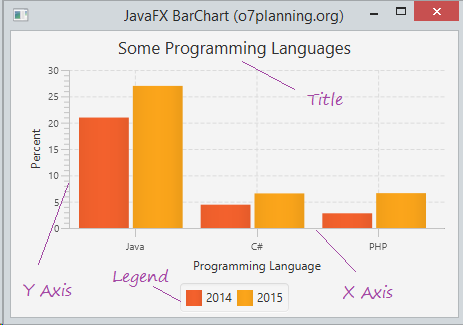
For example, the below data describes popularity of some programming languages in 2014 and 2015.
2014 | 2015 | |
Java | 20.973% | 26.983% |
C# | 4.429% | 6.569% |
PHP | 2.792% | 6.619% |
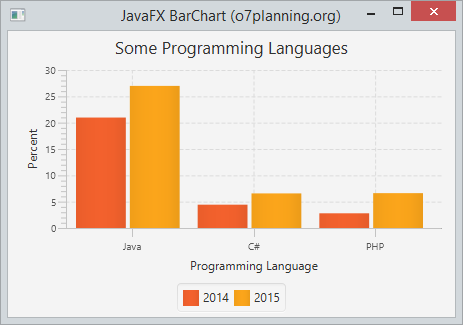
You can use BarChart to draw the chart decribing the popularity of programming languages with the above-mentioned data. Let's see illustrative example below:
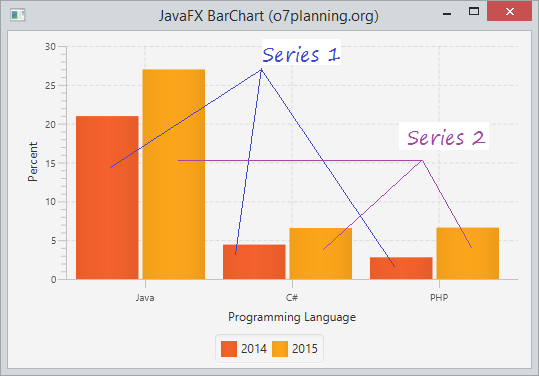
The X-axis expresses interested programming languages, the Y-axis is numeric data describing the market share of the languages. There are 2 series, one is data of 2014, the other is data of 2015.
2. BarChart example
BarChartDemo.java
package org.o7planning.javafx.barchart;

import javafx.application.Application;
import javafx.scene.Scene;
import javafx.scene.chart.BarChart;
import javafx.scene.chart.CategoryAxis;
import javafx.scene.chart.NumberAxis;
import javafx.scene.chart.XYChart;
import javafx.scene.layout.VBox;
import javafx.stage.Stage;

public class BarChartDemo extends Application {

   @Override
   public void start(Stage primaryStage) throws Exception {

       CategoryAxis xAxis = new CategoryAxis();
       xAxis.setLabel("Programming Language");

       NumberAxis yAxis = new NumberAxis();
       yAxis.setLabel("Percent");

       // Create a BarChart
       BarChart<String, Number> barChart = new BarChart<String, Number>(xAxis, yAxis);

       // Series 1 - Data of 2014
       XYChart.Series<String, Number> dataSeries1 = new XYChart.Series<String, Number>();
       dataSeries1.setName("2014");

       dataSeries1.getData().add(new XYChart.Data<String, Number>("Java", 20.973));
       dataSeries1.getData().add(new XYChart.Data<String, Number>("C#", 4.429));
       dataSeries1.getData().add(new XYChart.Data<String, Number>("PHP", 2.792));

       // Series 2 - Data of 2015
       XYChart.Series<String, Number> dataSeries2 = new XYChart.Series<String, Number>();
       dataSeries2.setName("2015");

       dataSeries2.getData().add(new XYChart.Data<String, Number>("Java", 26.983));
       dataSeries2.getData().add(new XYChart.Data<String, Number>("C#", 6.569));
       dataSeries2.getData().add(new XYChart.Data<String, Number>("PHP", 6.619));

       // Add Series to BarChart.
       barChart.getData().add(dataSeries1);
       barChart.getData().add(dataSeries2);

       barChart.setTitle("Some Programming Languages");

       VBox vbox = new VBox(barChart);

       primaryStage.setTitle("JavaFX BarChart (o7planning.org)");
       Scene scene = new Scene(vbox, 400, 200);

       primaryStage.setScene(scene);
       primaryStage.setHeight(300);
       primaryStage.setWidth(400);

       primaryStage.show();
   }

   public static void main(String[] args) {
       Application.launch(args);
   }
}
3. Horizontal BarChart
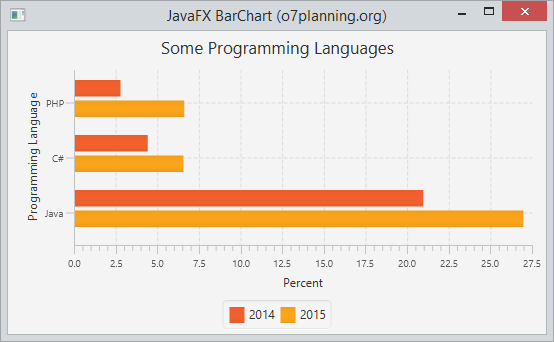
By default, the Y-axis is often to describe numeric data, X-axis is to describe interested objects. In this case, BarChart is a vertical chart. However, you can also create a horizontal one. Let's see the illustrative example:
HorizontalBarChartDemo.java
package org.o7planning.javafx.barchart;

import javafx.application.Application;
import javafx.scene.Scene;
import javafx.scene.chart.BarChart;
import javafx.scene.chart.CategoryAxis;
import javafx.scene.chart.NumberAxis;
import javafx.scene.chart.XYChart;
import javafx.scene.layout.VBox;
import javafx.stage.Stage;

public class HorizontalBarChartDemo extends Application {

    @Override
    public void start(Stage primaryStage) throws Exception {

        CategoryAxis xAxis = new CategoryAxis();
        xAxis.setLabel("Programming Language");

        NumberAxis yAxis = new NumberAxis();

        yAxis.setLabel("Percent");

        // Create a BarChart
        BarChart<Number, String> barChart = new BarChart<Number, String>(yAxis, xAxis);

        // Series 1 - Data of 2014
        XYChart.Series<Number, String> dataSeries1 = new XYChart.Series<Number, String>();
        dataSeries1.setName("2014");

        dataSeries1.getData().add(new XYChart.Data<Number, String>(20.973, "Java"));
        dataSeries1.getData().add(new XYChart.Data<Number, String>(4.429, "C#"));
        dataSeries1.getData().add(new XYChart.Data<Number, String>(2.792, "PHP"));

        // Series 2 - Data of 2015
        XYChart.Series<Number, String> dataSeries2 = new XYChart.Series<Number, String>();
        dataSeries2.setName("2015");

        dataSeries2.getData().add(new XYChart.Data<Number, String>(26.983, "Java"));
        dataSeries2.getData().add(new XYChart.Data<Number, String>(6.569, "C#"));
        dataSeries2.getData().add(new XYChart.Data<Number, String>(6.619, "PHP"));

        // Add Series to BarChart.
        barChart.getData().add(dataSeries1);
        barChart.getData().add(dataSeries2);

        barChart.setTitle("Some Programming Languages");

        VBox vbox = new VBox(barChart);

        primaryStage.setTitle("JavaFX BarChart (o7planning.org)");
        Scene scene = new Scene(vbox, 400, 200);

        primaryStage.setScene(scene);
        primaryStage.setHeight(300);
        primaryStage.setWidth(400);

        primaryStage.show();
    }

    public static void main(String[] args) {
        Application.launch(args);
    }
}
4. Custom BarChart
// Set show Tick Marks
xAxis.setTickMarkVisible(true);

// Rotate the label of Tick Marks 90 degrees
xAxis.setTickLabelRotation(90);

// Set color for lable of Tick marks
xAxis.setTickLabelFill(Color.RED);

// Set Font
xAxis.setTickLabelFont( new Font("Arial", 15));

// Set legend position.
barChart.setLegendSide(Side.LEFT);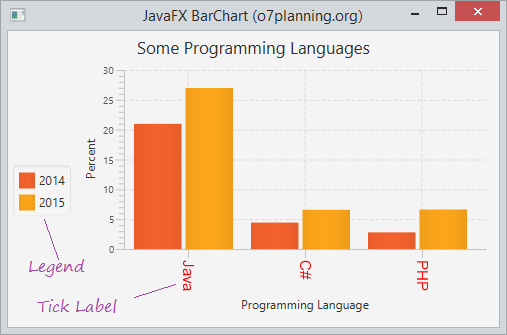
5. Manage animation when data changes
When data changes, you could update to re-draw the chart. JavaFX allows you to create animated effects in order to re-draw the chart from new data.
// Changing random data after every 1 second.
Timeline timeline = new Timeline();
timeline.getKeyFrames().add(new KeyFrame(Duration.millis(1000), new EventHandler<ActionEvent>() {
   @Override
   public void handle(ActionEvent actionEvent) {
       for (XYChart.Series<String, Number> series : barChart.getData()) {
           for (XYChart.Data<String, Number> data : series.getData()) {
               Number yValue = data.getYValue();
               Number randomValue = yValue.doubleValue() * (0.5 + Math.random());
               data.setYValue(randomValue);
           }
       }
   }
}));
// Repeat indefinitely until stop() method is called.
timeline.setCycleCount(Animation.INDEFINITE);
timeline.setAutoReverse(true);
timeline.play();
View full example:
AnimationBarChartDemo.java
package org.o7planning.javafx.barchart;
import javafx.animation.Animation;
import javafx.animation.KeyFrame;
import javafx.animation.Timeline;
import javafx.application.Application;
import javafx.event.ActionEvent;
import javafx.event.EventHandler;
import javafx.scene.Scene;
import javafx.scene.chart.BarChart;
import javafx.scene.chart.CategoryAxis;
import javafx.scene.chart.NumberAxis;
import javafx.scene.chart.XYChart;
import javafx.scene.layout.VBox;
import javafx.stage.Stage;
import javafx.util.Duration;
public class AnimationBarChartDemo extends Application {
@Override
public void start(Stage primaryStage) throws Exception {
CategoryAxis xAxis = new CategoryAxis();
xAxis.setLabel("Programming Language");
NumberAxis yAxis = new NumberAxis();
yAxis.setLabel("Percent");
// Create a BarChart
BarChart<String, Number> barChart = new BarChart<String, Number>(xAxis, yAxis);
// Series 1 - Data of 2014
XYChart.Series<String, Number> dataSeries1 = new XYChart.Series<String, Number>();
dataSeries1.setName("2014");
dataSeries1.getData().add(new XYChart.Data<String, Number>("Java", 20.973));
dataSeries1.getData().add(new XYChart.Data<String, Number>("C#", 4.429));
dataSeries1.getData().add(new XYChart.Data<String, Number>("PHP", 2.792));
// Series 2 - Data of 2015
XYChart.Series<String, Number> dataSeries2 = new XYChart.Series<String, Number>();
dataSeries2.setName("2015");
dataSeries2.getData().add(new XYChart.Data<String, Number>("Java", 26.983));
dataSeries2.getData().add(new XYChart.Data<String, Number>("C#", 6.569));
dataSeries2.getData().add(new XYChart.Data<String, Number>("PHP", 6.619));
// Add Series to BarChart.
barChart.getData().add(dataSeries1);
barChart.getData().add(dataSeries2);
barChart.setTitle("Some Programming Languages");
// Changing random data after every 1 second.
Timeline timeline = new Timeline();
timeline.getKeyFrames().add(new KeyFrame(Duration.millis(1000), new EventHandler<ActionEvent>() {
@Override
public void handle(ActionEvent actionEvent) {
for (XYChart.Series<String, Number> series : barChart.getData()) {
for (XYChart.Data<String, Number> data : series.getData()) {
Number yValue = data.getYValue();
Number randomValue = yValue.doubleValue() * (0.5 + Math.random());
data.setYValue(randomValue);
}
}
}
}));
// Repeat indefinitely until stop() method is called.
timeline.setCycleCount(Animation.INDEFINITE);
timeline.setAutoReverse(true);
timeline.play();
VBox vbox = new VBox(barChart);
primaryStage.setTitle("JavaFX BarChart (o7planning.org)");
Scene scene = new Scene(vbox, 400, 200);
primaryStage.setScene(scene);
primaryStage.setHeight(300);
primaryStage.setWidth(400);
primaryStage.show();
}
public static void main(String[] args) {
Application.launch(args);
}
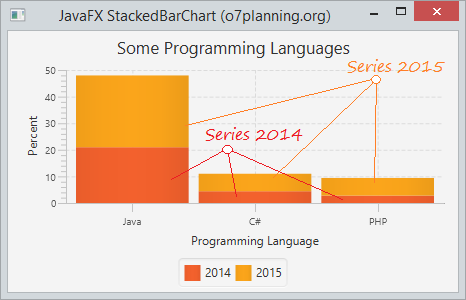
}6. JavaFX StackedBarChart
There are no differences between the creation of BarChart and StackedBarChart. The only difference is the way to display the data. For StackedBarChart, Series will be stacked up together.
StackedBarChartDemo.java
package org.o7planning.javafx.stackedbarchart;

import javafx.application.Application;
import javafx.scene.Scene;
import javafx.scene.chart.CategoryAxis;
import javafx.scene.chart.NumberAxis;
import javafx.scene.chart.StackedBarChart;
import javafx.scene.chart.XYChart;
import javafx.scene.layout.VBox;
import javafx.stage.Stage;

public class StackedBarChartDemo extends Application {

    @Override
    public void start(Stage primaryStage) throws Exception {

        CategoryAxis xAxis = new CategoryAxis();
        xAxis.setLabel("Programming Language");

        NumberAxis yAxis = new NumberAxis();
        yAxis.setLabel("Percent");

        // Create a StackedBarChart
        StackedBarChart<String, Number> barChart = new StackedBarChart<String, Number>(xAxis, yAxis);

        // Series 1 - Data of 2014
        XYChart.Series<String, Number> dataSeries1 = new XYChart.Series<String, Number>();
        dataSeries1.setName("2014");

        dataSeries1.getData().add(new XYChart.Data<String, Number>("Java", 20.973));
        dataSeries1.getData().add(new XYChart.Data<String, Number>("C#", 4.429));
        dataSeries1.getData().add(new XYChart.Data<String, Number>("PHP", 2.792));

        // Series 2 - Data of 2015
        XYChart.Series<String, Number> dataSeries2 = new XYChart.Series<String, Number>();
        dataSeries2.setName("2015");

        dataSeries2.getData().add(new XYChart.Data<String, Number>("Java", 26.983));
        dataSeries2.getData().add(new XYChart.Data<String, Number>("C#", 6.569));
        dataSeries2.getData().add(new XYChart.Data<String, Number>("PHP", 6.619));

        // Add Series to StackedBarChart.
        barChart.getData().add(dataSeries1);
        barChart.getData().add(dataSeries2);

        barChart.setTitle("Some Programming Languages");

        VBox vbox = new VBox(barChart);

        primaryStage.setTitle("JavaFX StackedBarChart (o7planning.org)");
        Scene scene = new Scene(vbox, 400, 200);

        primaryStage.setScene(scene);
        primaryStage.setHeight(300);
        primaryStage.setWidth(400);

        primaryStage.show();
    }

    public static void main(String[] args) {
        Application.launch(args);
    }
}JavaFX Tutorials
- Open a new Window in JavaFX
- JavaFX ChoiceDialog Tutorial with Examples
- JavaFX Alert Dialogs Tutorial with Examples
- JavaFX TextInputDialog Tutorial with Examples
- Install e(fx)clipse for Eclipse (JavaFX Tooling)
- Install JavaFX Scene Builder for Eclipse
- JavaFX Tutorial for Beginners - Hello JavaFX
- JavaFX FlowPane Layout Tutorial with Examples
- JavaFX TilePane Layout Tutorial with Examples
- JavaFX HBox, VBox Layout Tutorial with Examples
- JavaFX BorderPane Layout Tutorial with Examples
- JavaFX AnchorPane Layout Tutorial with Examples
- JavaFX TitledPane Tutorial with Examples
- JavaFX Accordion Tutorial with Examples
- JavaFX ListView Tutorial with Examples
- JavaFX Group Tutorial with Examples
- JavaFX ComboBox Tutorial with Examples
- JavaFX Transformations Tutorial with Examples
- JavaFX Effects Tutorial with Examples
- JavaFX GridPane Layout Tutorial with Examples
- JavaFX StackPane Layout Tutorial with Examples
- JavaFX ScrollPane Tutorial with Examples
- JavaFX WebView and WebEngine Tutorial with Examples
- JavaFX HTMLEditor Tutorial with Examples
- JavaFX TableView Tutorial with Examples
- JavaFX TreeView Tutorial with Examples
- JavaFX TreeTableView Tutorial with Examples
- JavaFX Menu Tutorial with Examples
- JavaFX ContextMenu Tutorial with Examples
- JavaFX Image and ImageView Tutorial with Examples
- JavaFX Label Tutorial with Examples
- JavaFX Hyperlink Tutorial with Examples
- JavaFX Button Tutorial with Examples
- JavaFX ToggleButton Tutorial with Examples
- JavaFX RadioButton Tutorial with Examples
- JavaFX MenuButton and SplitMenuButton Tutorial with Examples
- JavaFX TextField Tutorial with Examples
- JavaFX PasswordField Tutorial with Examples
- JavaFX TextArea Tutorial with Examples
- JavaFX Slider Tutorial with Examples
- JavaFX Spinner Tutorial with Examples
- JavaFX ProgressBar and ProgressIndicator Tutorial with Examples
- JavaFX ChoiceBox Tutorial with Examples
- JavaFX Tooltip Tutorial with Examples
- JavaFX DatePicker Tutorial with Examples
- JavaFX ColorPicker Tutorial with Examples
- JavaFX FileChooser and DirectoryChooser Tutorial with Examples
- JavaFX PieChart Tutorial with Examples
- JavaFX AreaChart and StackedAreaChart Tutorial with Examples
- JavaFX BarChart and StackedBarChart Tutorial with Examples
- JavaFX Line Tutorial with Examples
- JavaFX Rectangle and Ellipse Tutorial with Examples
Show More