JavaFX PieChart Tutorial with Examples
1. JavaFX PieChart
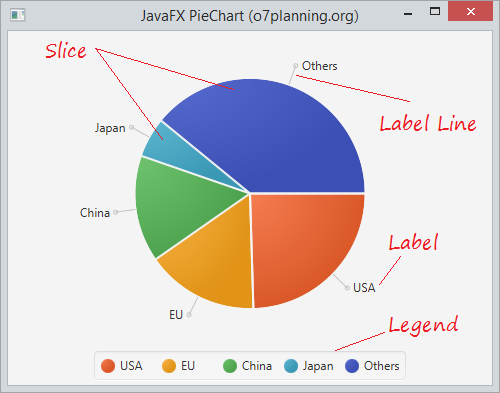
JavaFX PieChart describes a chart that represents data in a form of circle divided into triangular wedges called slices. Each slice represents a percentage that corresponds to a particular value.
GDP data for some countries in 2015:
Country | GDP (Million dollars) |
USA | 17.947.195 |
EU | 11.540.278 |
China | 10.982.829 |
Japan | 4.116.242 |
Others | 28.584.442 |

2. PieChart example
The example below is the PieChart describing GDP of some coutries in 2015.
PieChartDemo.java
package org.o7planning.javafx.piechart;

import javafx.application.Application;
import javafx.geometry.Side;
import javafx.scene.Scene;
import javafx.scene.chart.PieChart;
import javafx.scene.layout.StackPane;
import javafx.stage.Stage;

public class PieChartDemo extends Application {

   @Override
   public void start(Stage primaryStage) throws Exception {

       PieChart pieChart = new PieChart();

       PieChart.Data slice1 = new PieChart.Data("USA", 17947195);
       PieChart.Data slice2 = new PieChart.Data("EU", 11540278);
       PieChart.Data slice3 = new PieChart.Data("China", 10982829);
       PieChart.Data slice4 = new PieChart.Data("Japan", 4116242);
       PieChart.Data slice5 = new PieChart.Data("Others", 28584442);

       pieChart.getData().add(slice1);
       pieChart.getData().add(slice2);
       pieChart.getData().add(slice3);
       pieChart.getData().add(slice4);
       pieChart.getData().add(slice5);

       pieChart.setLegendSide(Side.LEFT);

       primaryStage.setTitle("JavaFX PieChart (o7planning.org)");
       StackPane root = new StackPane(pieChart);

       Scene scene = new Scene(root, 400, 200);

       primaryStage.setScene(scene);

       primaryStage.show();
   }

   public static void main(String[] args) {
       Application.launch(args);
   }
}
3. Custom PieChart
By default PieChart to full display its components, including Labels, and Legend. You can set up the components to display or not display by setLabelsVisile, setLegendVisible methods.
pieChart.setLabelsVisile(false);
pieChart.setLegendVisible(false);
Set up the Lgend display position and and length of Label Line.
chart.setLabelLineLength(10);
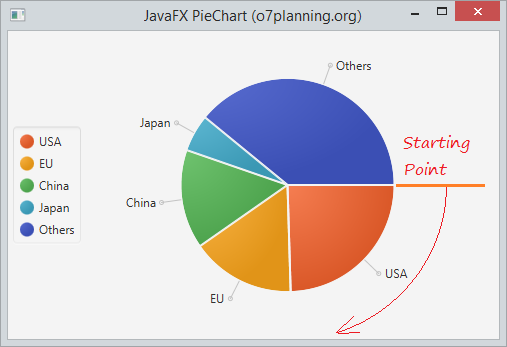
chart.setLegendSide(Side.LEFT);By default, the slices are set up according to clockwise direction. However, you also can set them up in reverse direction using setClockwise(false) method.
Along clockwise:
Counterclockwise:
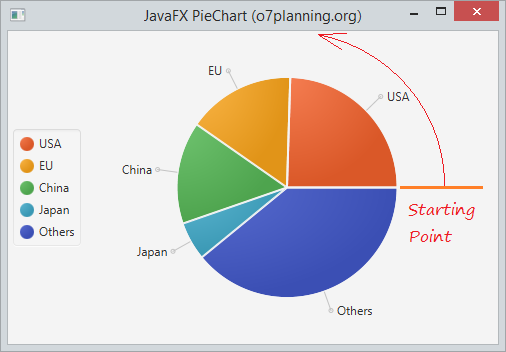
You also can change the starting angle of PieChart via setStartAngle method.
pieChart.setStartAngle(30);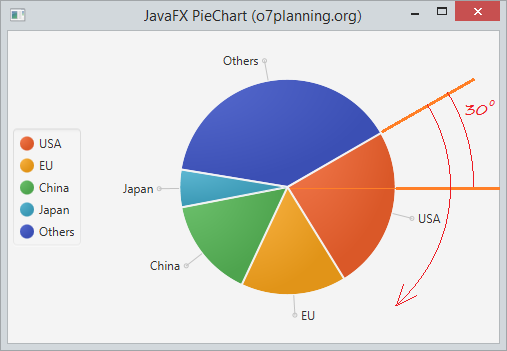
4. PieChart and events
Although a pie chart slice is not a Node object, each PieChart.Data element has a node associated with it, which can be used to analyze events and process them accordingly
PieChartEventDemo.java
package org.o7planning.javafx.piechart;

import javafx.application.Application;
import javafx.event.EventHandler;
import javafx.geometry.Side;
import javafx.scene.Scene;
import javafx.scene.chart.PieChart;
import javafx.scene.control.Label;
import javafx.scene.input.MouseEvent;
import javafx.scene.layout.AnchorPane;
import javafx.scene.paint.Color;
import javafx.stage.Stage;

public class PieChartEventDemo extends Application {

    @Override
    public void start(Stage primaryStage) throws Exception {

        PieChart pieChart = new PieChart();

        PieChart.Data slice1 = new PieChart.Data("USA", 17947195);
        PieChart.Data slice2 = new PieChart.Data("EU", 11540278);
        PieChart.Data slice3 = new PieChart.Data("China", 10982829);
        PieChart.Data slice4 = new PieChart.Data("Japan", 4116242);
        PieChart.Data slice5 = new PieChart.Data("Others", 28584442);

        pieChart.getData().add(slice1);
        pieChart.getData().add(slice2);
        pieChart.getData().add(slice3);
        pieChart.getData().add(slice4);
        pieChart.getData().add(slice5);

        pieChart.setPrefSize(400, 300);

        pieChart.setLegendSide(Side.LEFT);
        pieChart.setStartAngle(30);

        final Label caption = new Label("");
        caption.setTextFill(Color.WHITE);
        caption.setStyle("-fx-font: 12 arial;");

        for (final PieChart.Data data : pieChart.getData()) {
            data.getNode().addEventHandler(MouseEvent.MOUSE_PRESSED, new EventHandler<MouseEvent>() {
                @Override
                public void handle(MouseEvent e) {
                    caption.setTranslateX(e.getSceneX());
                    caption.setTranslateY(e.getSceneY());

                    caption.setText(String.valueOf(data.getPieValue()));
                }
            });
        }

        primaryStage.setTitle("JavaFX PieChart (o7planning.org)");
        AnchorPane root = new AnchorPane();
        root.getChildren().addAll(pieChart, caption);


        Scene scene = new Scene(root, 400, 300);

        primaryStage.setScene(scene);

        primaryStage.show();
    }

    public static void main(String[] args) {
        Application.launch(args);
    }
}
JavaFX Tutorials
- Open a new Window in JavaFX
- JavaFX ChoiceDialog Tutorial with Examples
- JavaFX Alert Dialogs Tutorial with Examples
- JavaFX TextInputDialog Tutorial with Examples
- Install e(fx)clipse for Eclipse (JavaFX Tooling)
- Install JavaFX Scene Builder for Eclipse
- JavaFX Tutorial for Beginners - Hello JavaFX
- JavaFX FlowPane Layout Tutorial with Examples
- JavaFX TilePane Layout Tutorial with Examples
- JavaFX HBox, VBox Layout Tutorial with Examples
- JavaFX BorderPane Layout Tutorial with Examples
- JavaFX AnchorPane Layout Tutorial with Examples
- JavaFX TitledPane Tutorial with Examples
- JavaFX Accordion Tutorial with Examples
- JavaFX ListView Tutorial with Examples
- JavaFX Group Tutorial with Examples
- JavaFX ComboBox Tutorial with Examples
- JavaFX Transformations Tutorial with Examples
- JavaFX Effects Tutorial with Examples
- JavaFX GridPane Layout Tutorial with Examples
- JavaFX StackPane Layout Tutorial with Examples
- JavaFX ScrollPane Tutorial with Examples
- JavaFX WebView and WebEngine Tutorial with Examples
- JavaFX HTMLEditor Tutorial with Examples
- JavaFX TableView Tutorial with Examples
- JavaFX TreeView Tutorial with Examples
- JavaFX TreeTableView Tutorial with Examples
- JavaFX Menu Tutorial with Examples
- JavaFX ContextMenu Tutorial with Examples
- JavaFX Image and ImageView Tutorial with Examples
- JavaFX Label Tutorial with Examples
- JavaFX Hyperlink Tutorial with Examples
- JavaFX Button Tutorial with Examples
- JavaFX ToggleButton Tutorial with Examples
- JavaFX RadioButton Tutorial with Examples
- JavaFX MenuButton and SplitMenuButton Tutorial with Examples
- JavaFX TextField Tutorial with Examples
- JavaFX PasswordField Tutorial with Examples
- JavaFX TextArea Tutorial with Examples
- JavaFX Slider Tutorial with Examples
- JavaFX Spinner Tutorial with Examples
- JavaFX ProgressBar and ProgressIndicator Tutorial with Examples
- JavaFX ChoiceBox Tutorial with Examples
- JavaFX Tooltip Tutorial with Examples
- JavaFX DatePicker Tutorial with Examples
- JavaFX ColorPicker Tutorial with Examples
- JavaFX FileChooser and DirectoryChooser Tutorial with Examples
- JavaFX PieChart Tutorial with Examples
- JavaFX AreaChart and StackedAreaChart Tutorial with Examples
- JavaFX BarChart and StackedBarChart Tutorial with Examples
- JavaFX Line Tutorial with Examples
- JavaFX Rectangle and Ellipse Tutorial with Examples
Show More