JasperReport Tutorial for Beginners
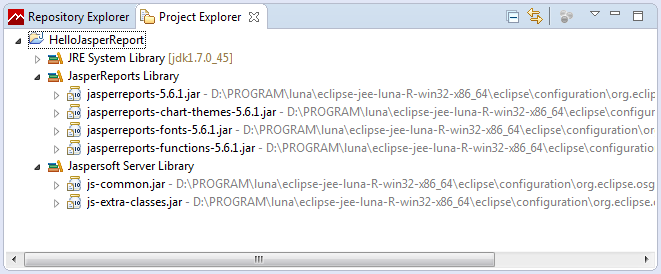
1. The installation requires
Jaspersoft Studio Plugin:
To program Jasperreport report you need to install JasperSoft Studio on Eclipse. You can see the instructions at:
LearningSQL
LearningSQL is a small database, used in many guidelines of o7planning.
Programming Guide of JasperReport also use the data on this Database. You need to create this database (only 5 minutes) as the instructions below:
Programming Guide of JasperReport also use the data on this Database. You need to create this database (only 5 minutes) as the instructions below:
Oracle:
SQL Server
MySQL
Database driver library (Oracle, MySQL, SQLServer) and usage:
Depending on which Database you use, you need that Database driver library (You need 3 minutes to complete), see the instructions for download at:
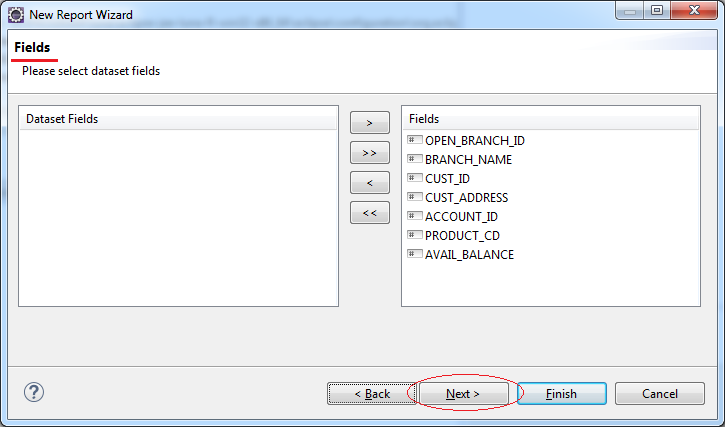
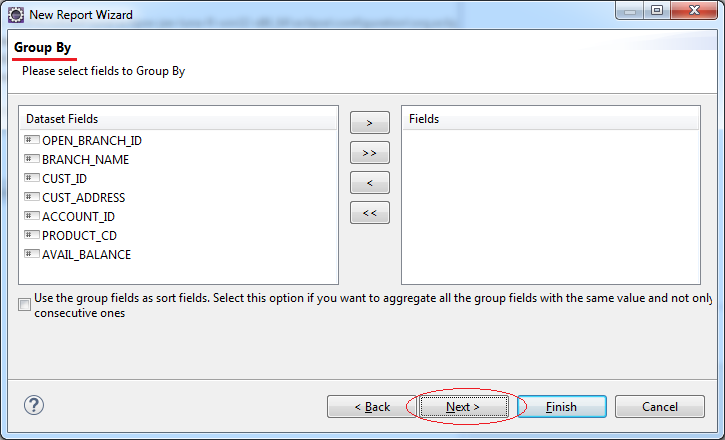
2. Reporting interface will design
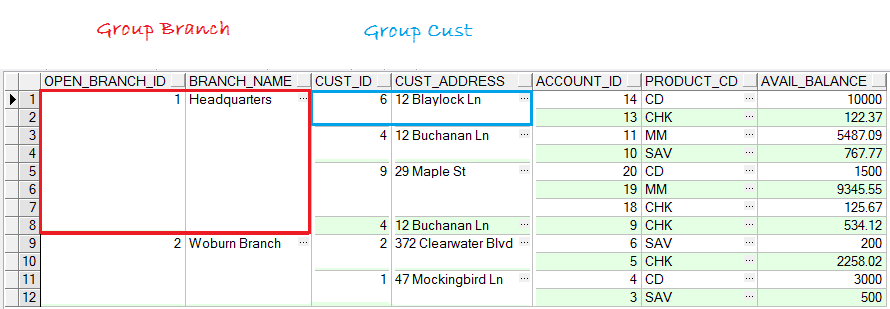
This is the raw data:
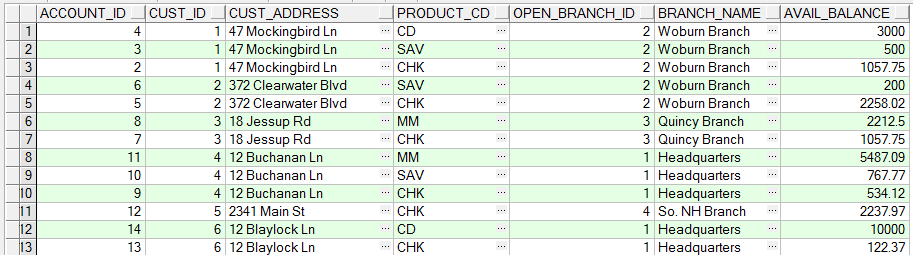
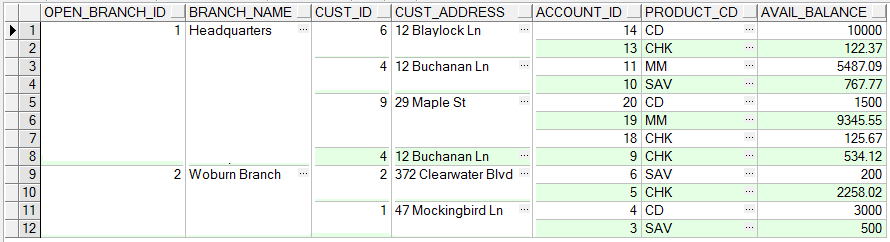
On the report, we group it to get a result as the following illustration:
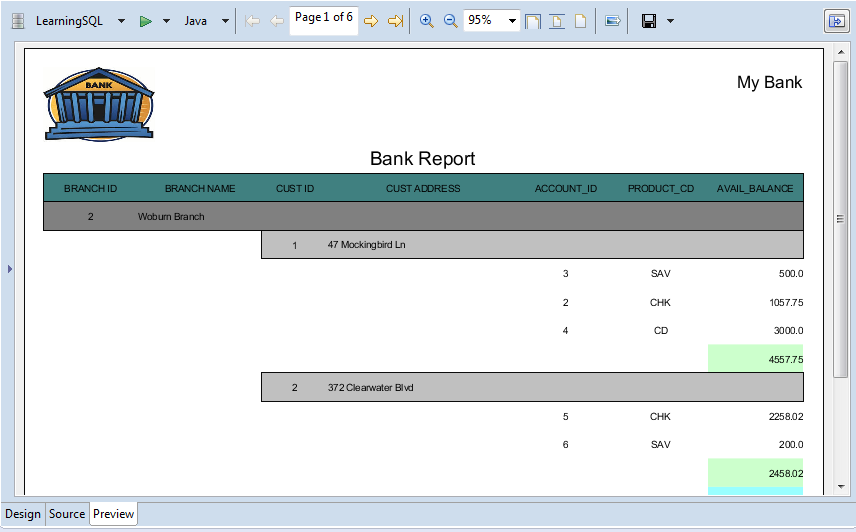
And here is the reporting interface:
SQL:
Select Acc.Open_Branch_Id
     ,Bra.Name           Branch_Name
     ,Acc.Cust_Id
     ,Cus.Address        Cust_Address
     ,Acc.Account_Id
     ,Acc.Product_Cd
     ,Acc.Avail_Balance
From   Account  Acc
     ,Customer Cus
     ,Branch   Bra
Where  Acc.Cust_Id = Cus.Cust_Id
And    Acc.Open_Branch_Id = Bra.Branch_Id
3. Create JasperReport Project
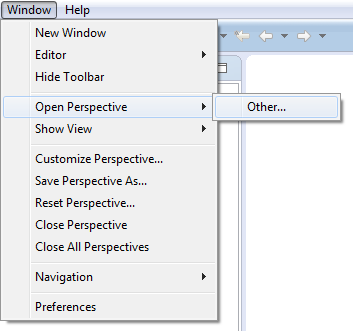
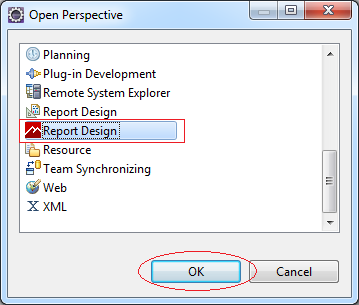
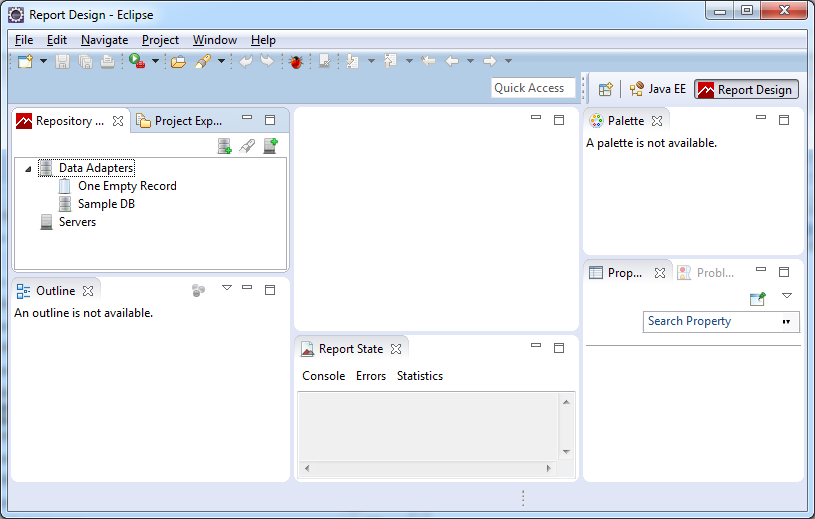
Open Perspective: Report Design.
Next, create a project:
- File/New/Other..
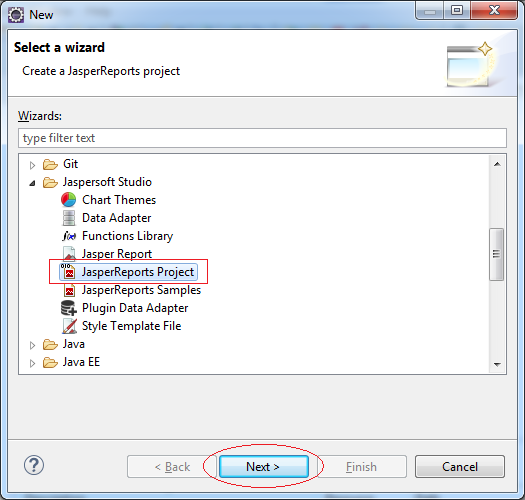
Enter the name of the Project:
- HelloJasperReport
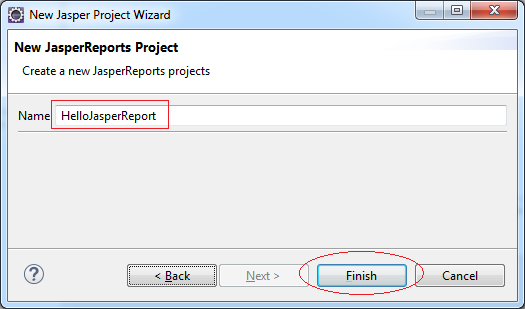
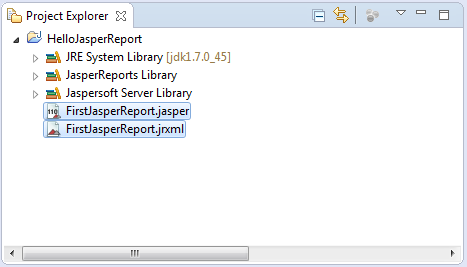
Project has been created:
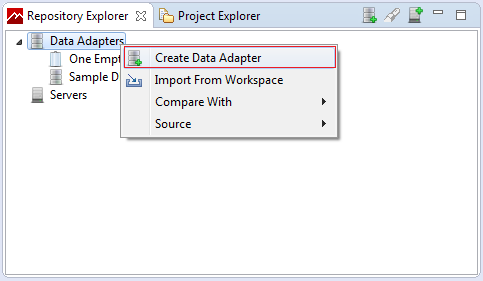
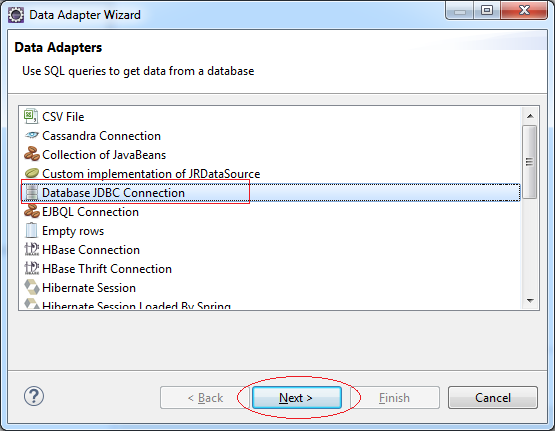
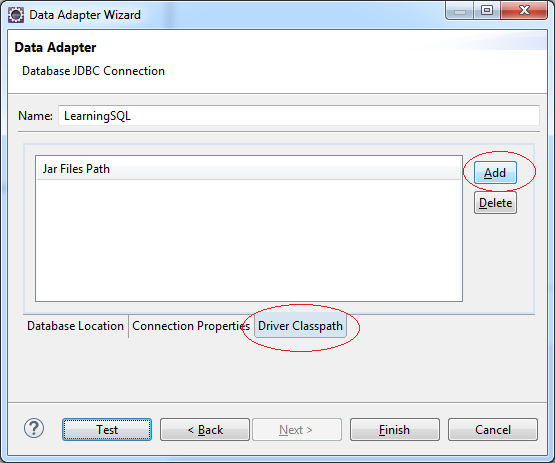
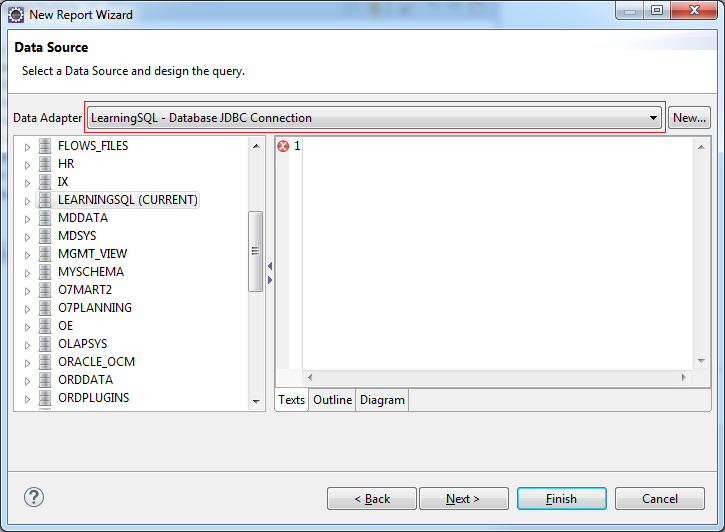
4. Create Data Adaptor
Here I connect with Oracle database. You can do the same with MySQL or SQLServer. There is some differences in the using library and URL Connection String.
For Oracle, Enter:
- JDBC Url: jdbc:oracle:thin:@localhost:1521:db11g
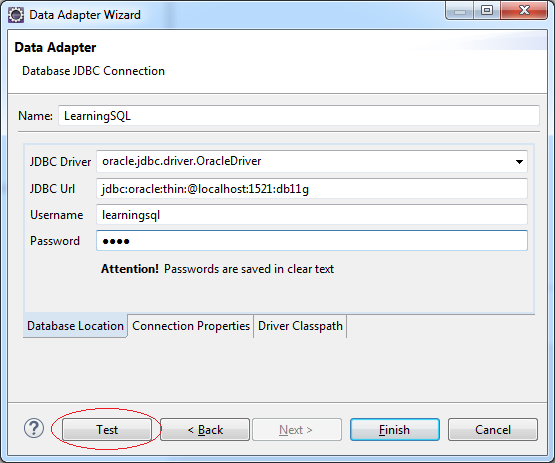
Error emerges when you do not declare the classpath of Database Library Driver.
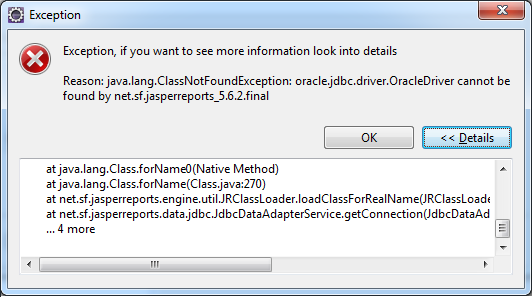
Just Add the jar file location, the JDBC Driver library for this database
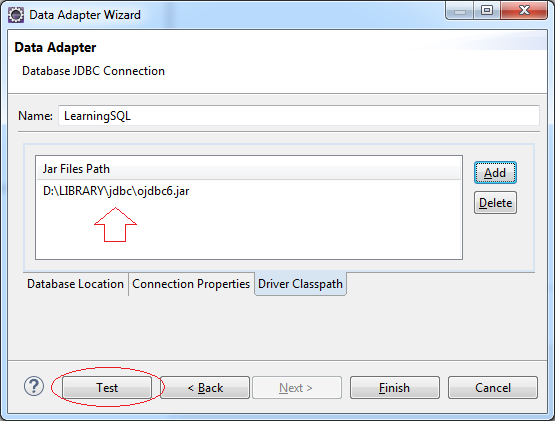
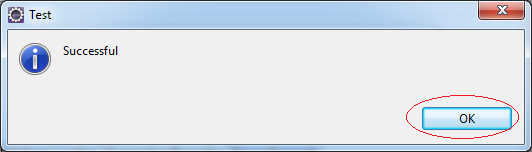
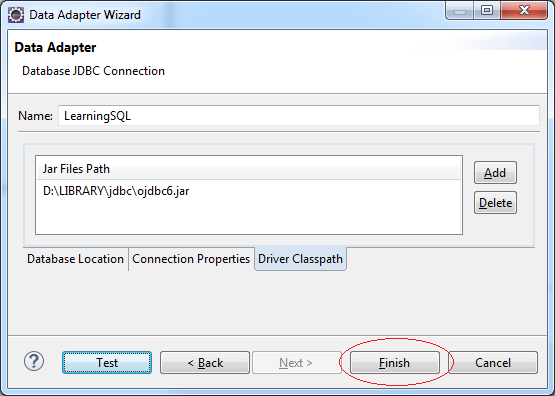
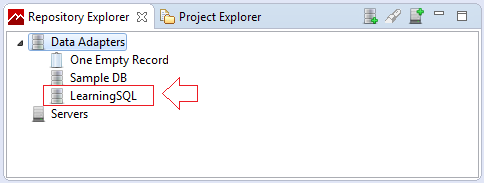
OK, Data Adaptor was created.
5. Design report
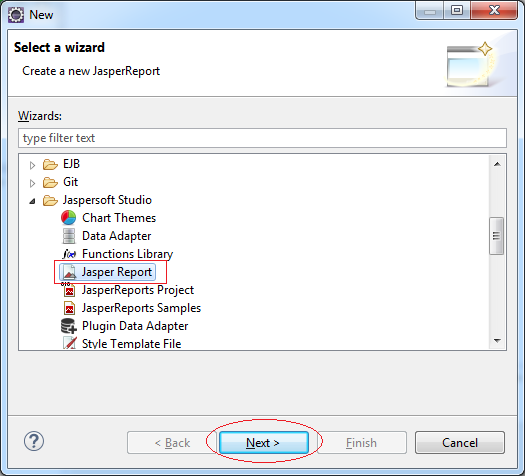
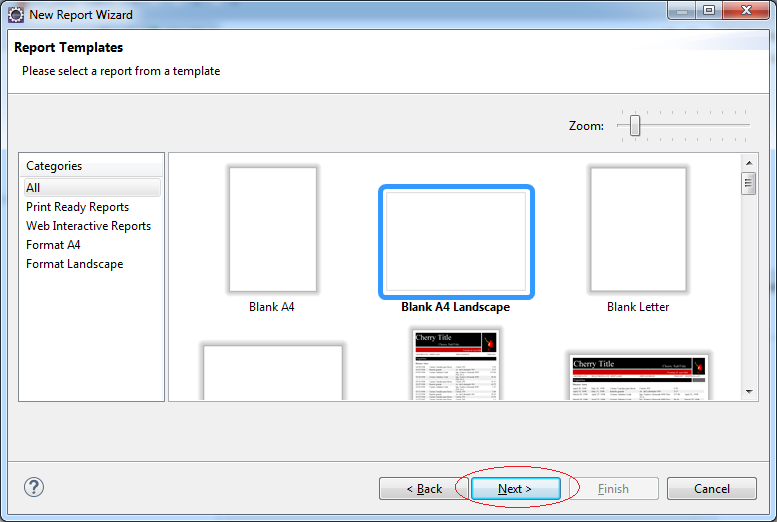
Create a new report
- File/New/Other...
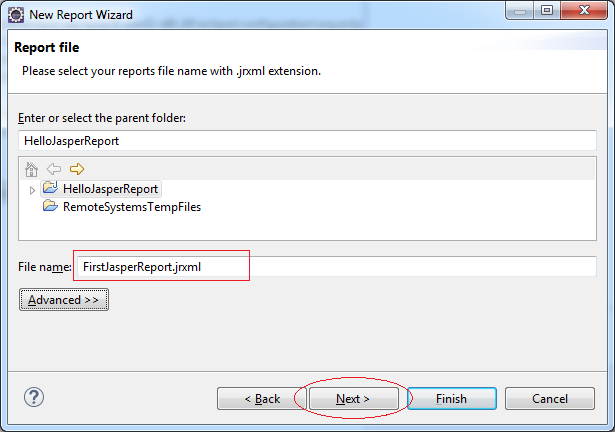
Enter the name of the report:
- FirstJasperReport
Select Acc.Open_Branch_Id
      ,Bra.Name           Branch_Name
      ,Acc.Cust_Id
      ,Cus.Address        Cust_Address
      ,Acc.Account_Id
      ,Acc.Product_Cd
      ,Acc.Avail_Balance
From   Account  Acc
      ,Customer Cus
      ,Branch   Bra
Where  Acc.Cust_Id = Cus.Cust_Id
And    Acc.Open_Branch_Id = Bra.Branch_Id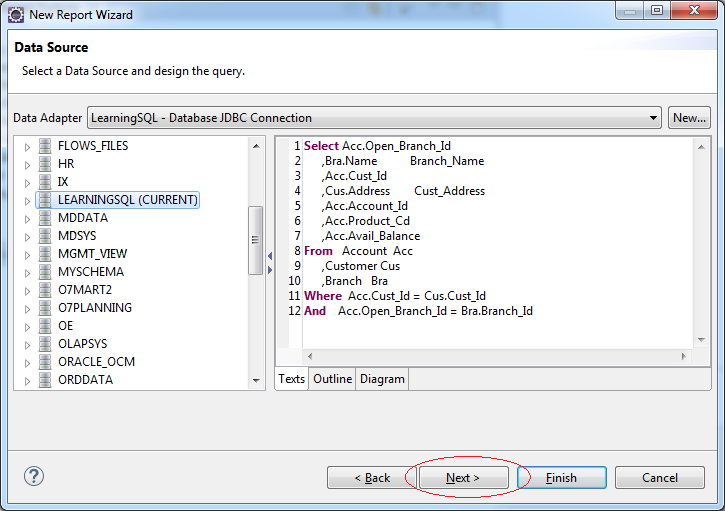
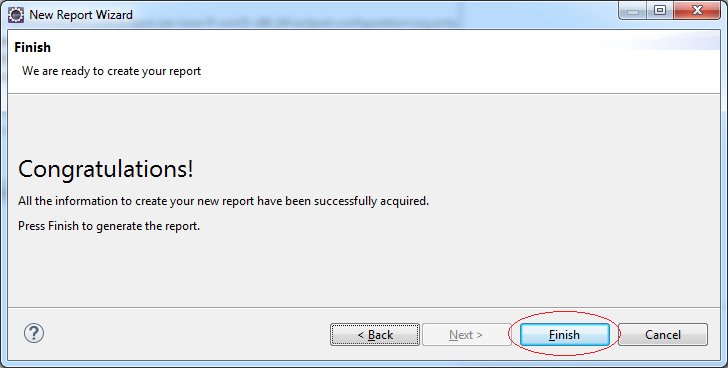
The report is generated.
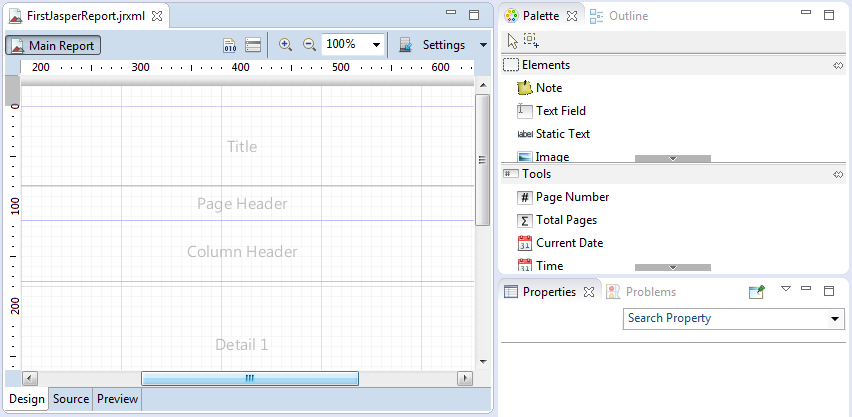
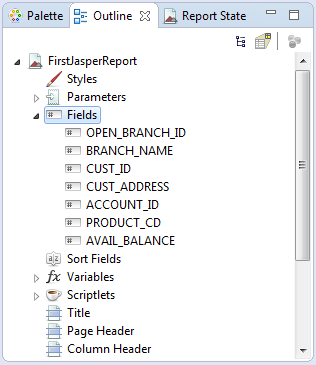
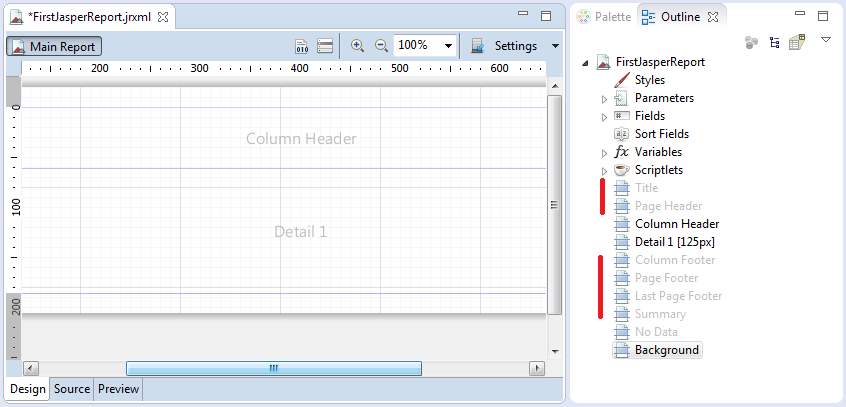
Outline View is very important. We often have to use it while designing a report.
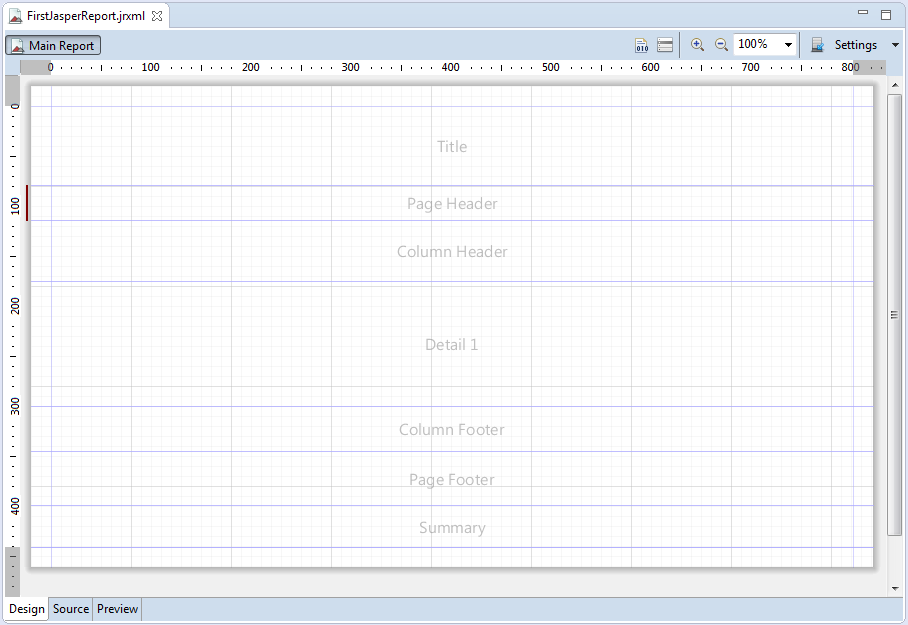
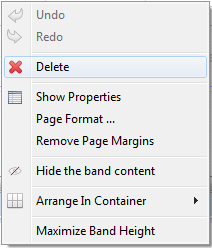
A blank report page is created. In which, parts of content of Page Header, Column Header,Column Footer, Page Footer are repeatedly displayed on each page of the report. You can delete unnecessary parts of content by right-click on it and click Delete.
Here I deleted all of parts, except for Column Header & Detail in order to make it easy to design. We can recreate them if necessary.
- Column Header: contains titles of data columns. It is duplicated in all pages by default.
- Detail: contains records. It repeat numbers of records.
Rough design report
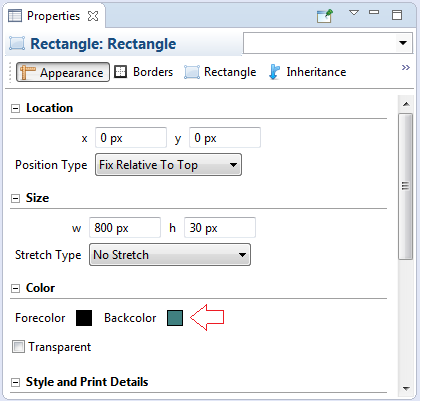
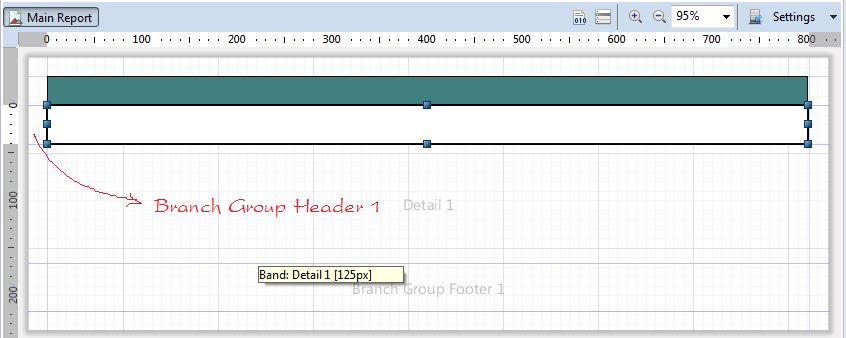
Drag and drop Rectangle object from Pallete to Column Header of the report. Then, fully spread out the width of Rectangle.
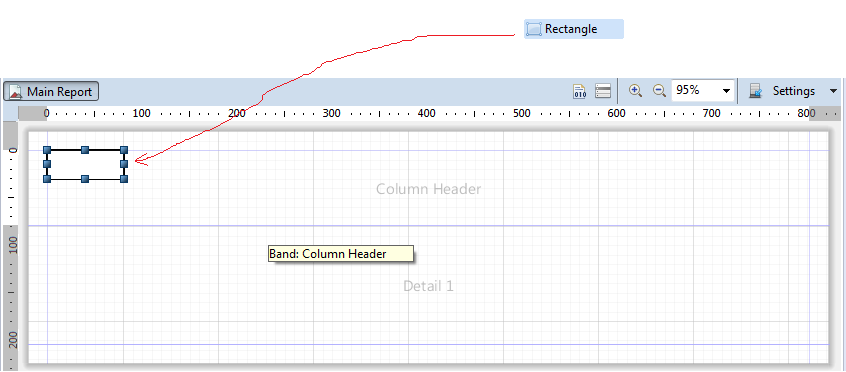
Next, adjust the height of Column Header so that it is equal to the height of newly-made Rectangle. The purpose is to erase unnecessary space in the report.
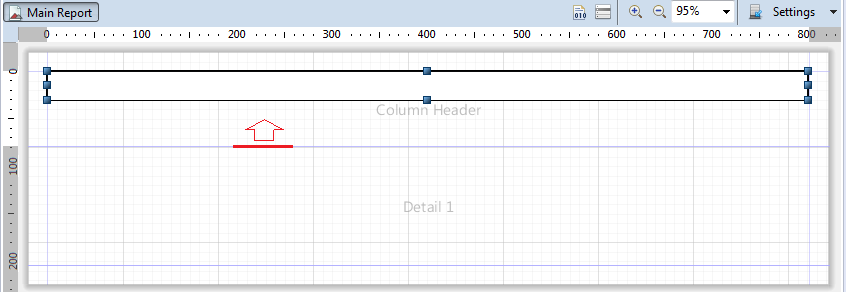
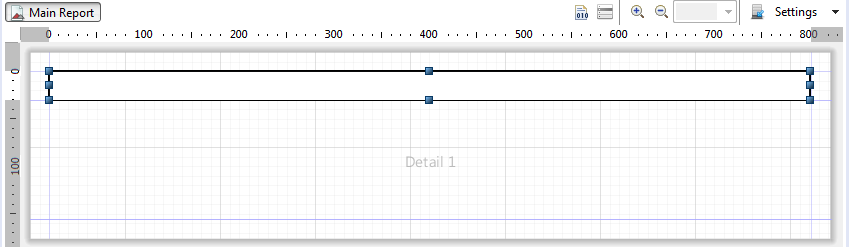
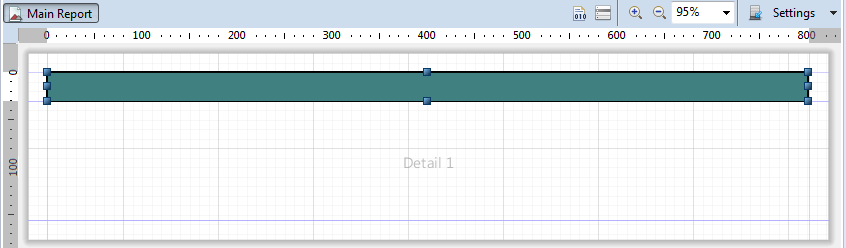
Results:
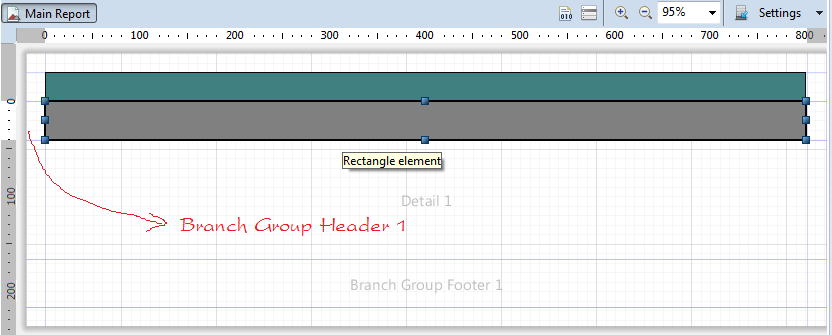
Change the background color of the rectangle:
Next, we create 2 groups in turn:
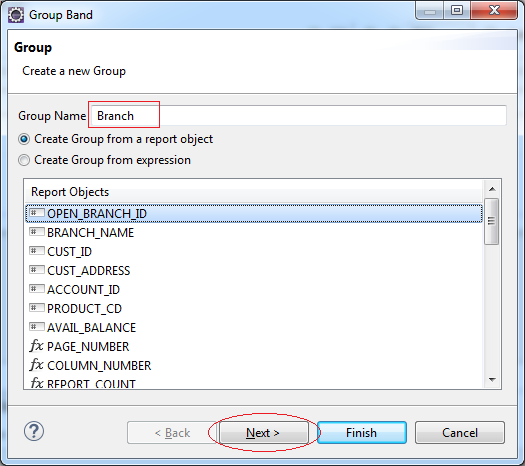
- Group Branch
- Group Cust
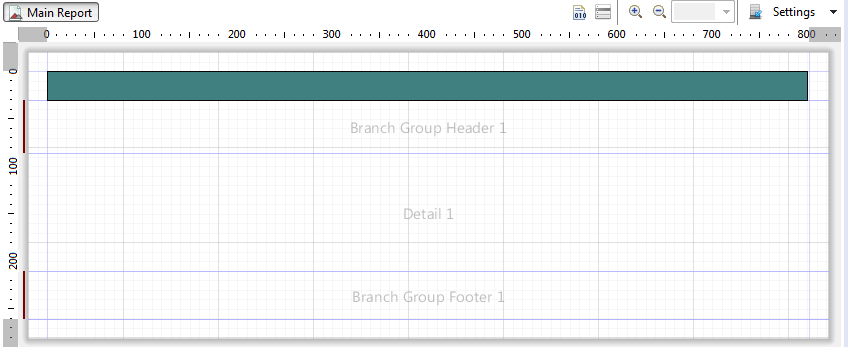
Their meaning is described in the following illustrative image:
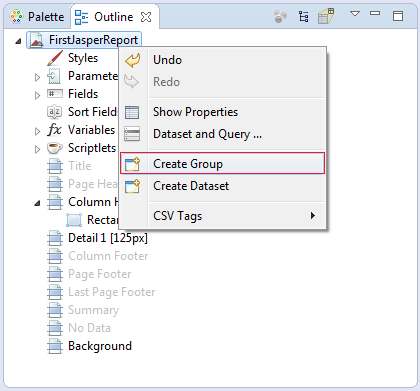
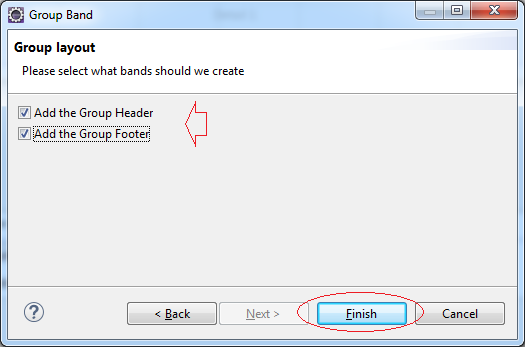
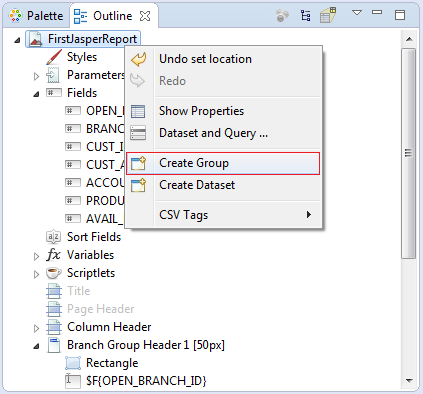
On the Outline, right click to FirstJasperReport, select Create Group:
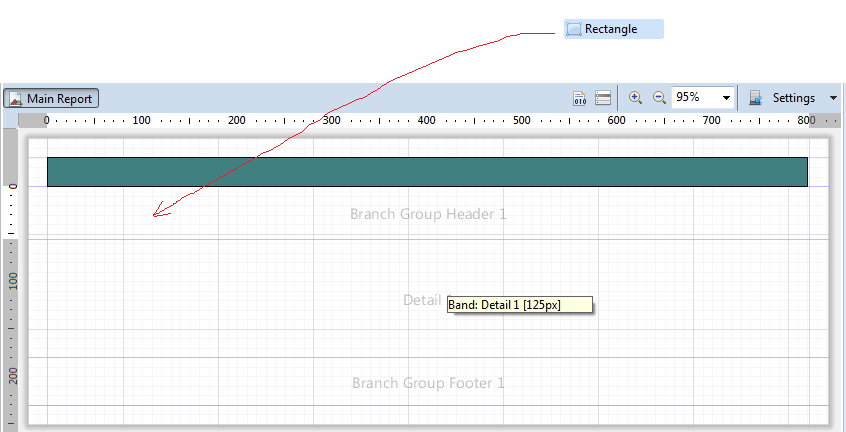
Next, we drag a Rectangle from Pallete to "Branch Group Header 1" area.
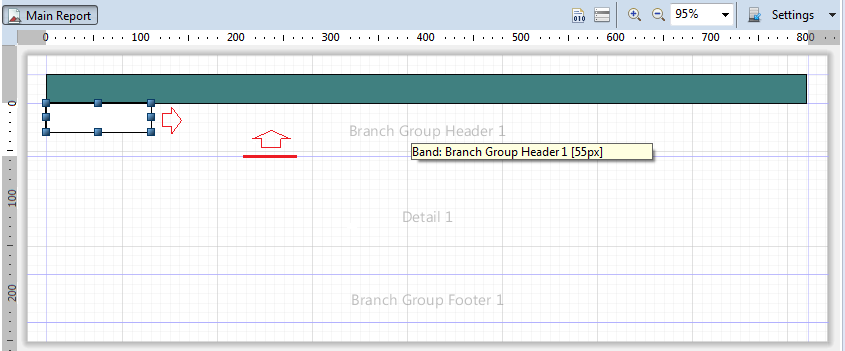
Change the background color for the rectangle you just created.
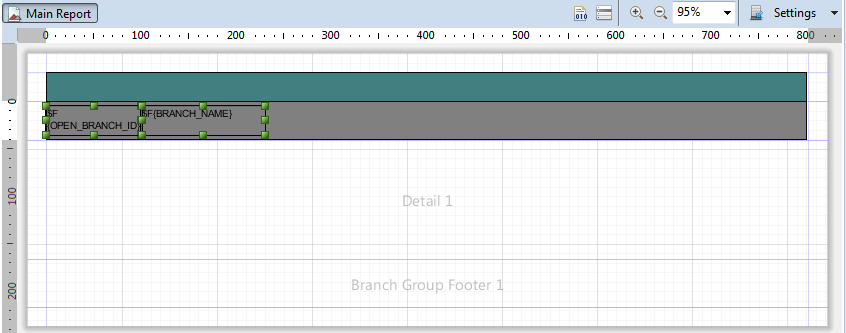
Next, we will drag drop respectively the Field Open_Branch_Id and Branch_Name into Rectangle on the block "Branch Group Header 1".
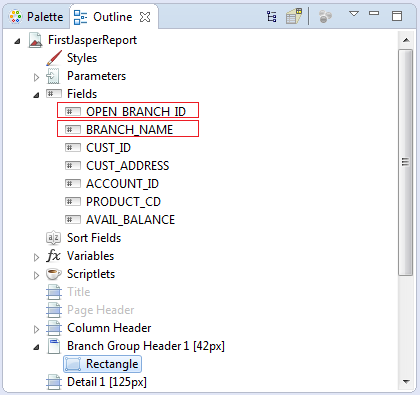
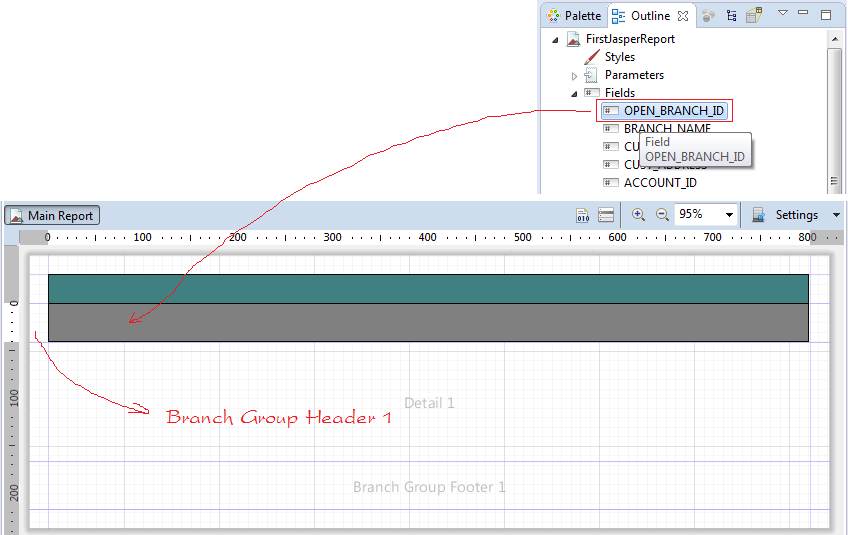
Similarly, we drag and drop Branch_Name next to Open_Branch_Id.
Next, Create Customer group:
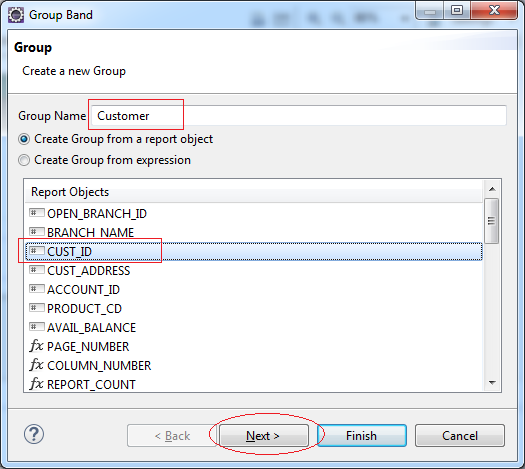
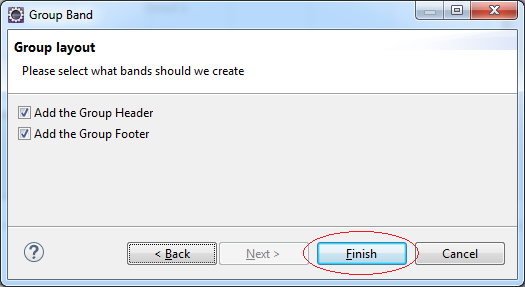
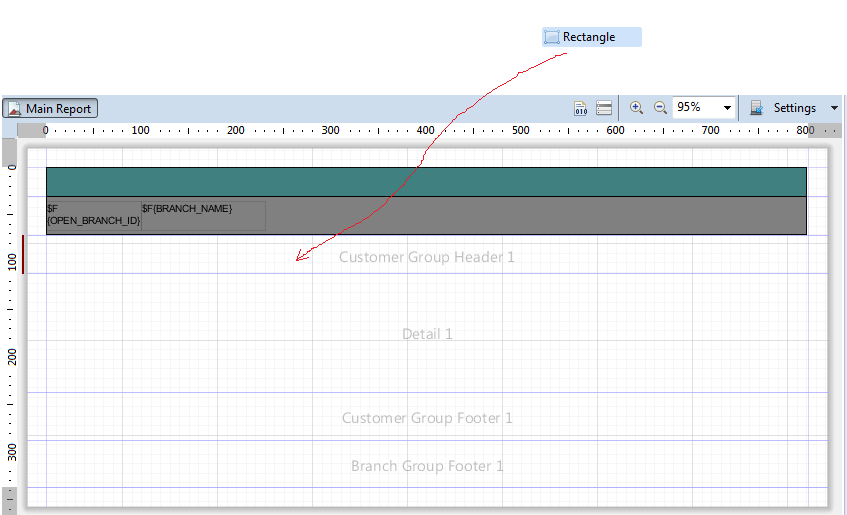
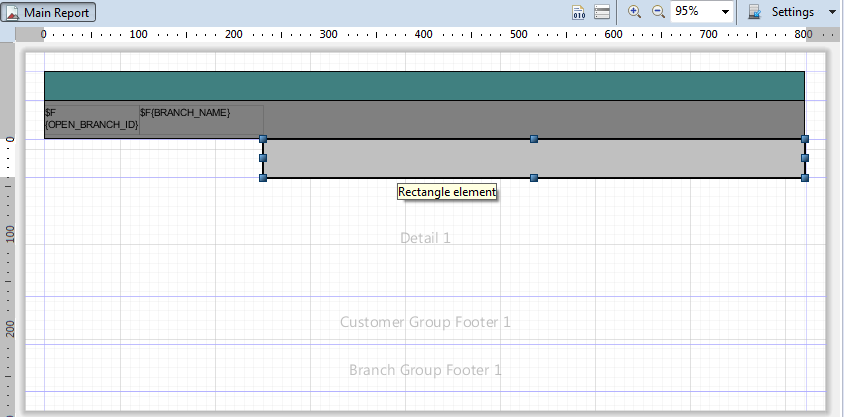
After Customer Group is created, drag and drop Rectangle object into "Customer Group Header 1". Adjust and change background of Rectangle as the following illustrative image:
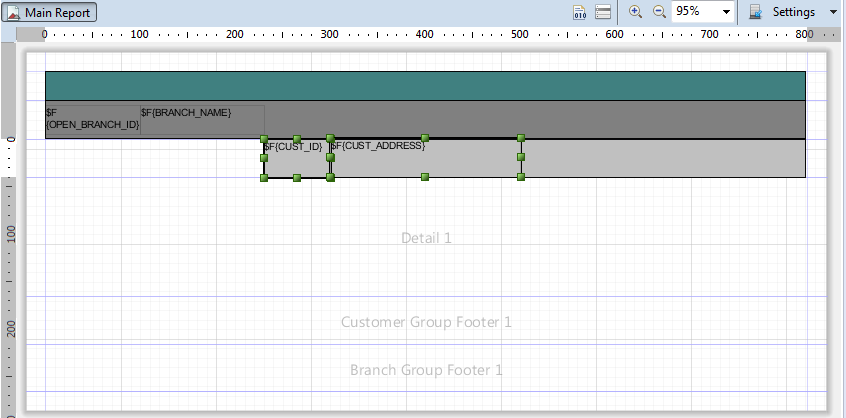
Drag & drop Field: Cust_ID into Rectangle just created.
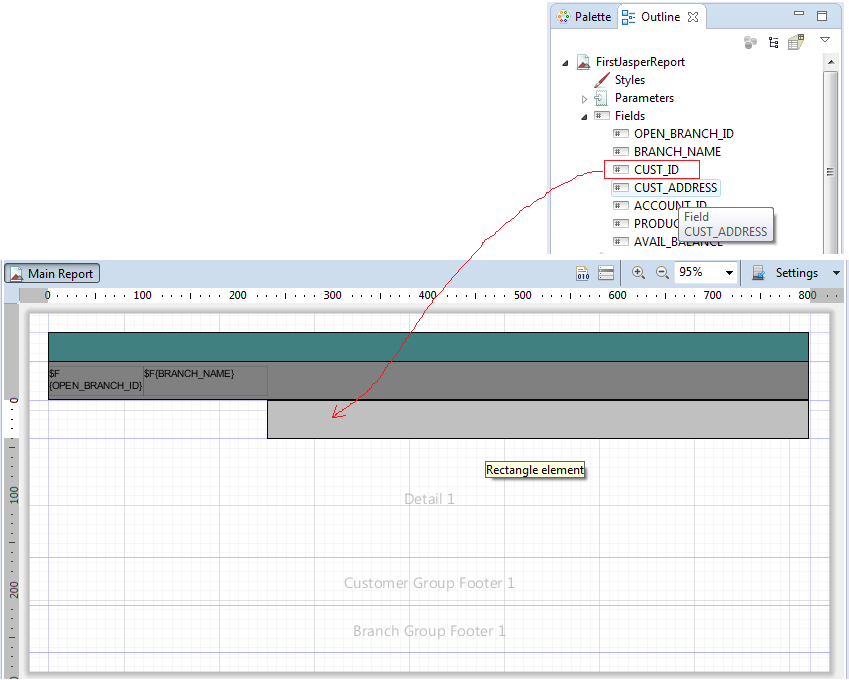
Similarly, drag & drop Cust_Address field.
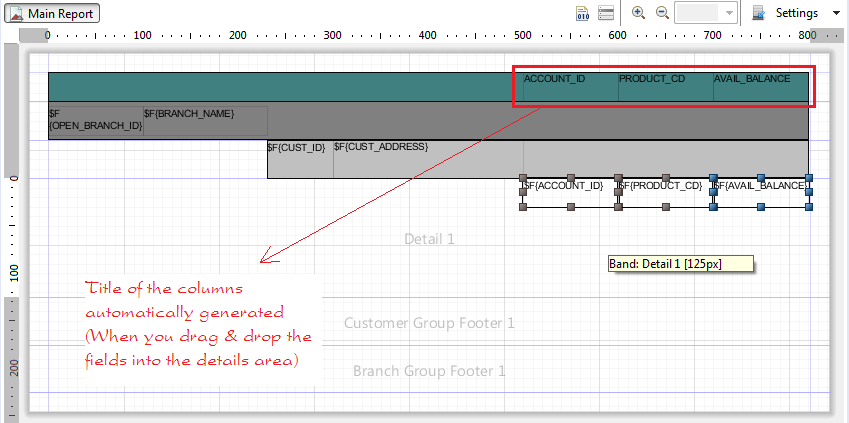
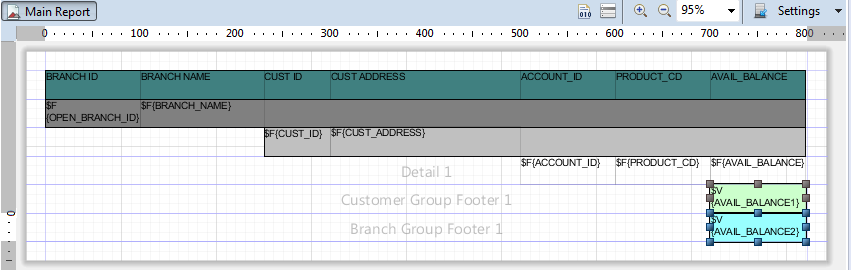
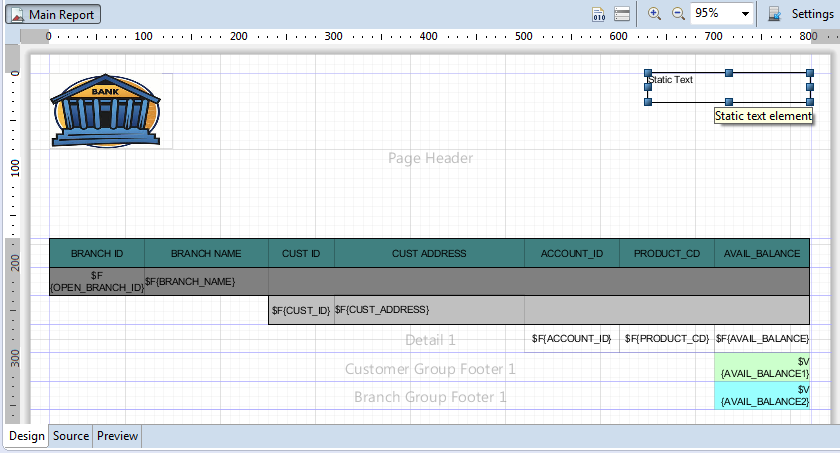
Next, drag and drop fields Account_Id, Product_Cd, Avail_Balance into "Detail 1" area in turn:
Note: If you drag and drop FIELDS into Detail area, column titles will be automatically created in Column Header area.
Adjust the height of "Detail 1" area to a minimum:
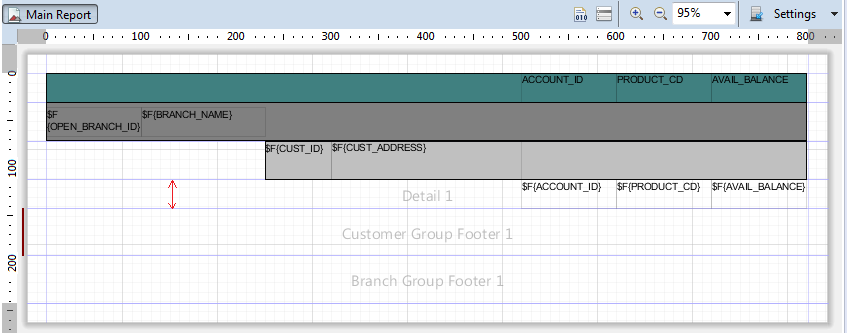
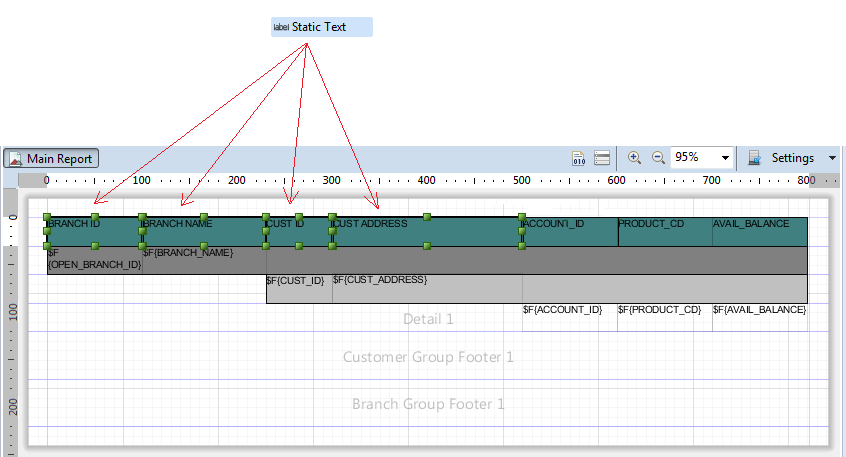
Next, drag and drop the remaining column titles:
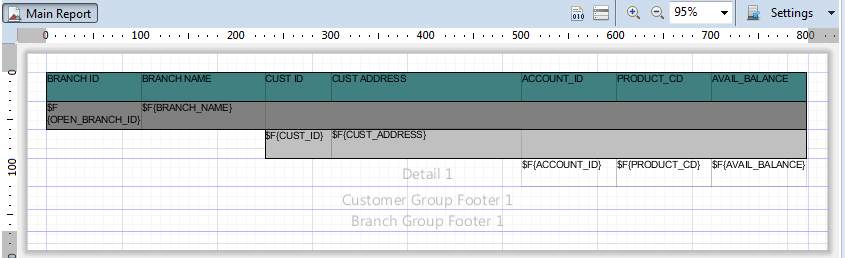
Minimize the height of 2 areas:
- Customer Group Footer 1
- Branch Group Footer 1
Next drag & drop Field: AVAIL_BALANCE into "Customer Group Footer 1" & "Branch Group Footer 1".
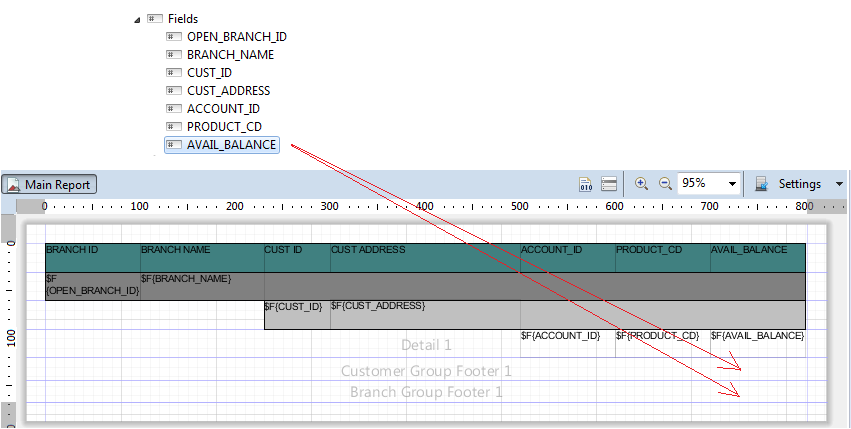
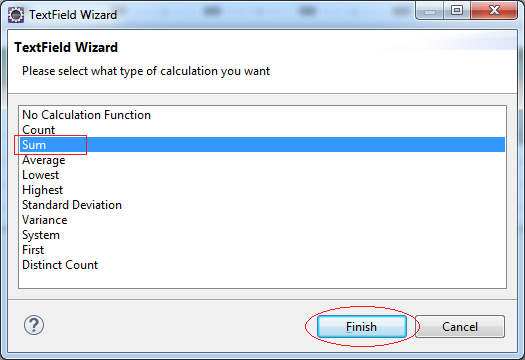
Simultaneously, we change background of two objects we have just dragged and dropped.
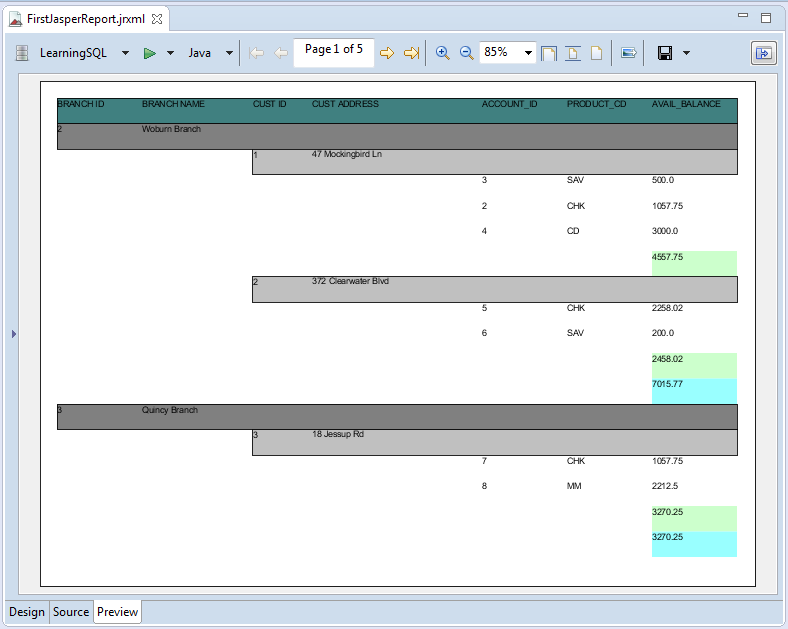
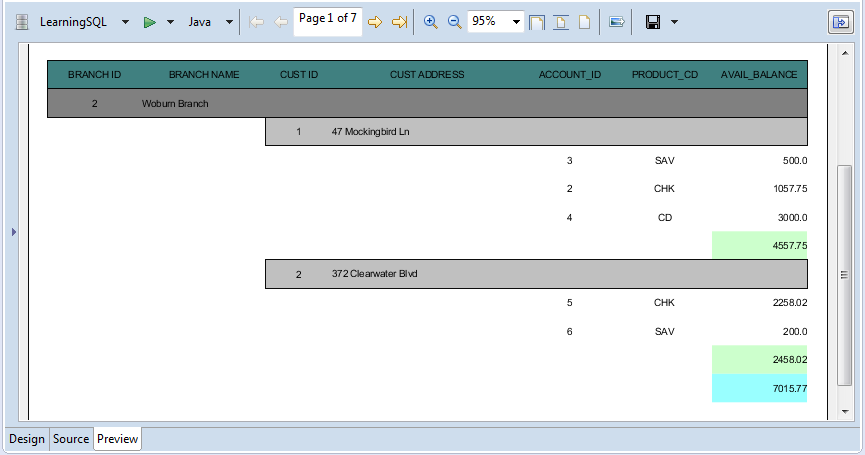
Run report (First time)
We test the report by clicking Preview TAB:
Beauty Report
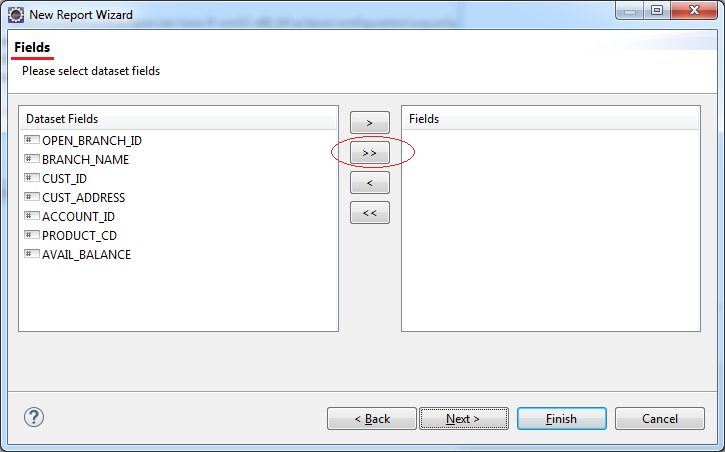
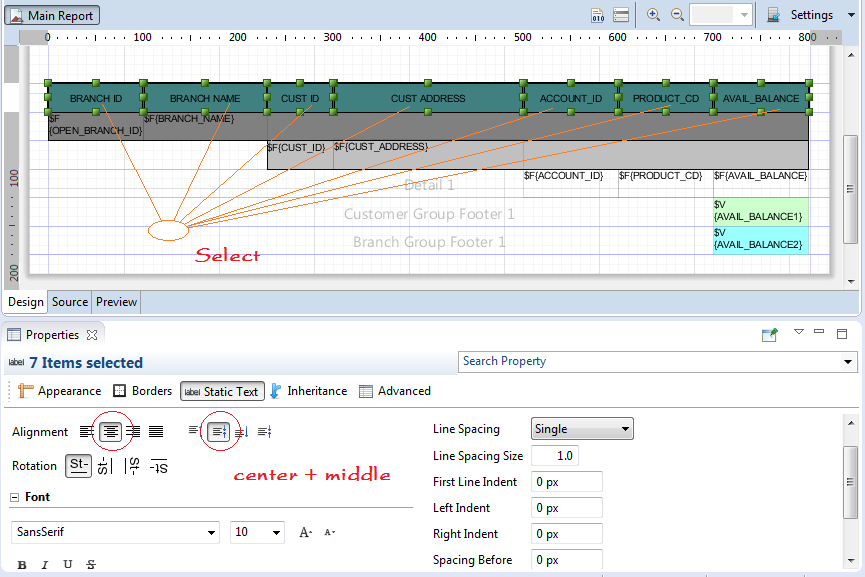
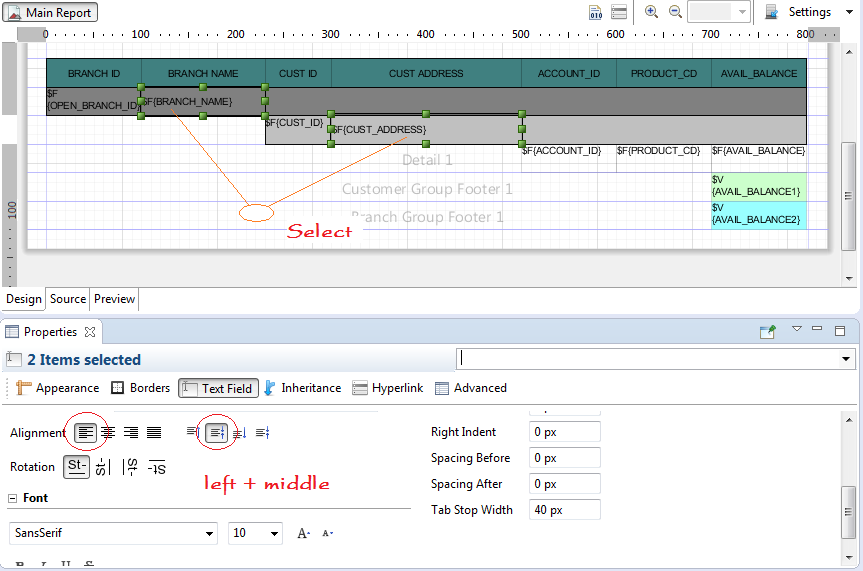
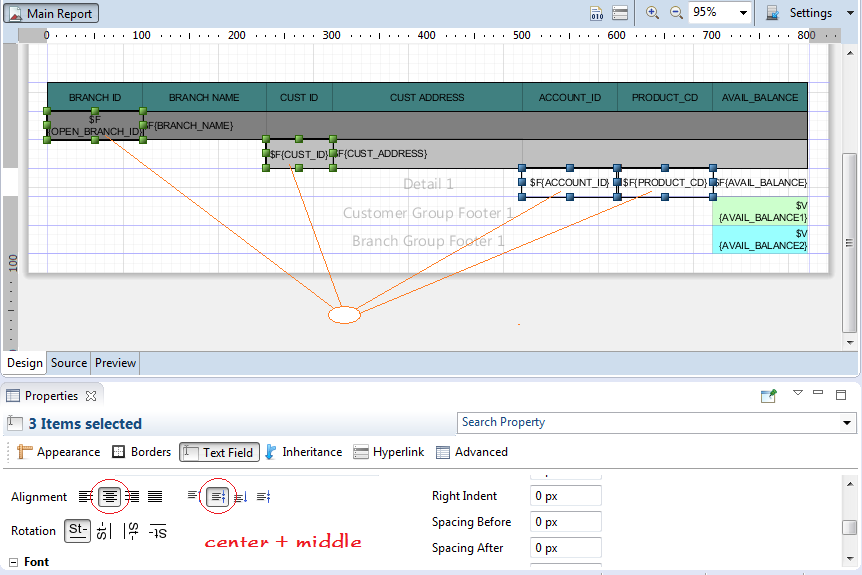
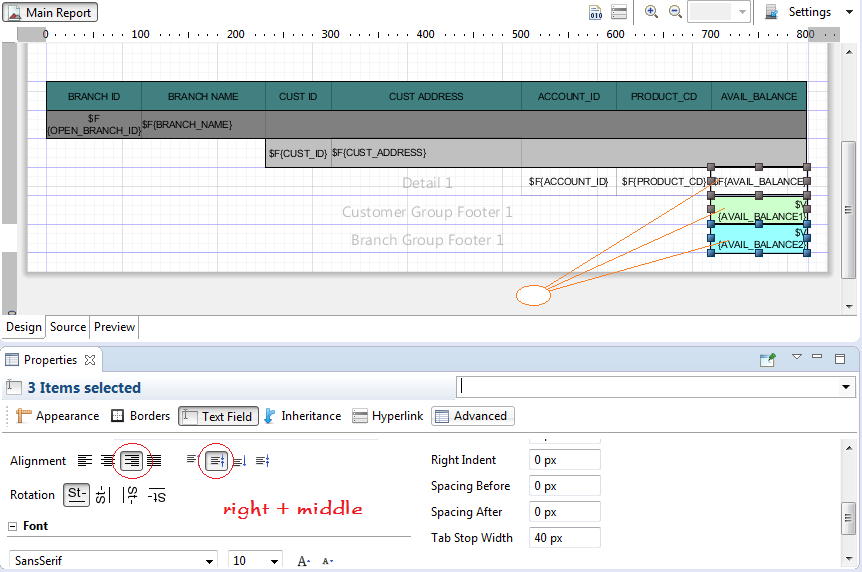
Selecting the fields, and setting properties as shown below.
Run Report (Second time)
Design Header section of the report
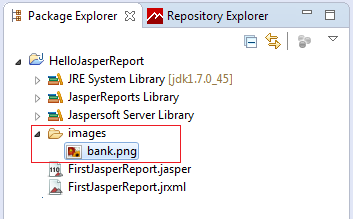
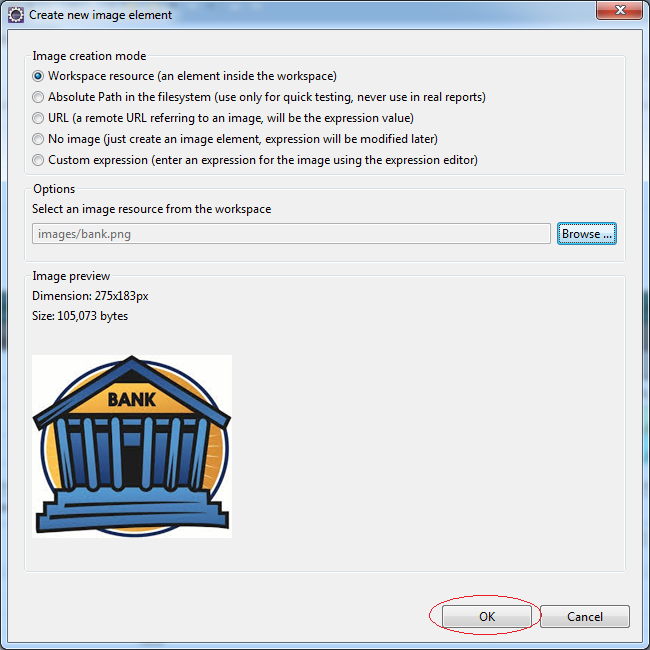
Create images folder in project, copy file bank.png to this folder, as illustrated below:
- bank.png

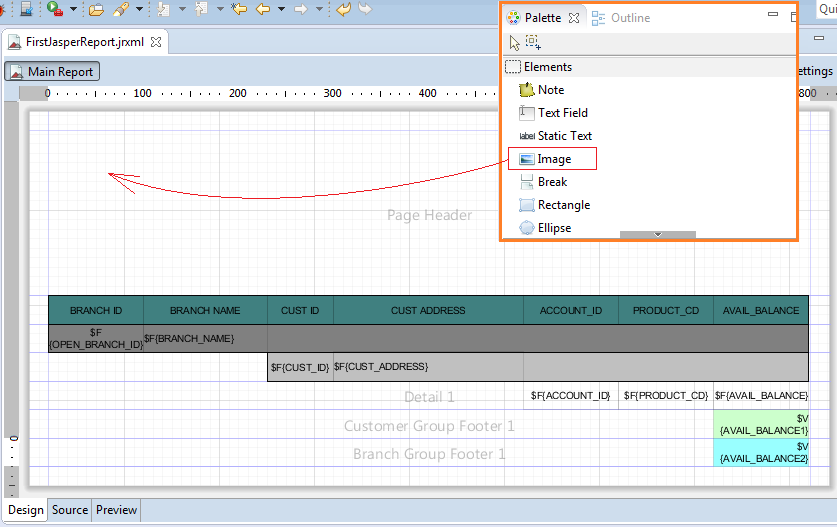
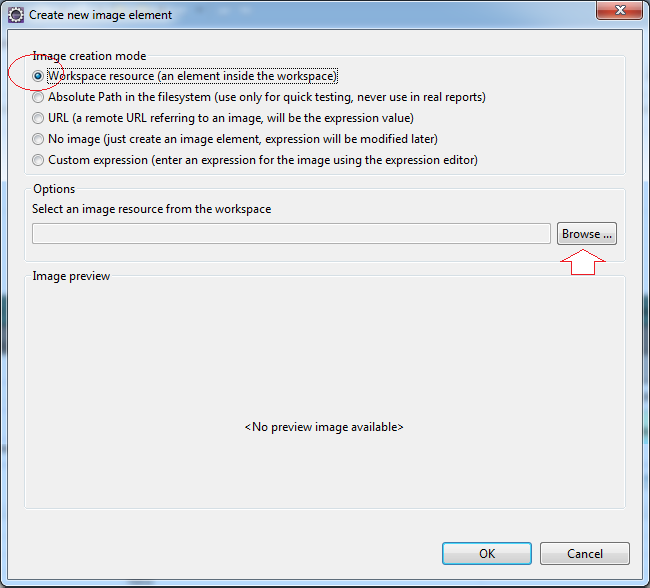
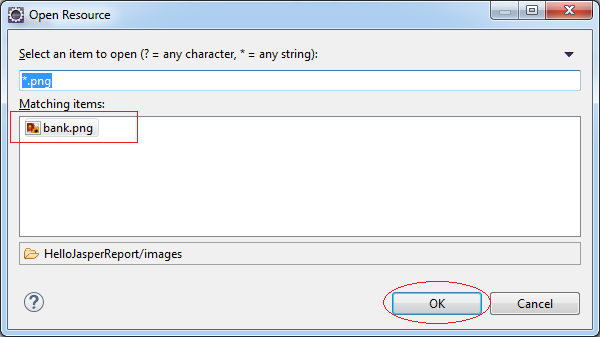
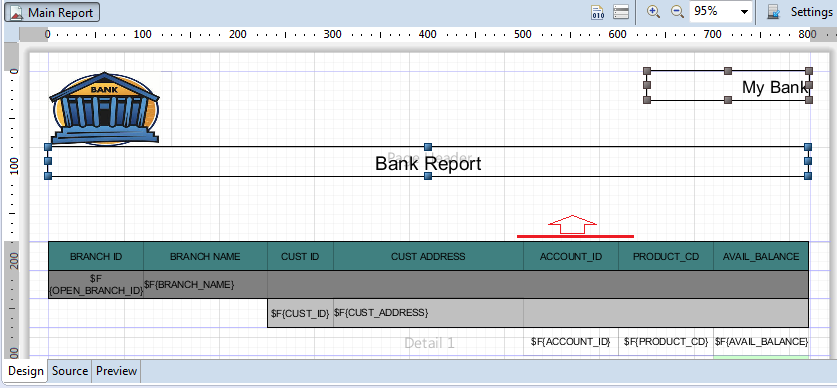
Drag and drop Image object from the Palette to the page header.
Next drag & drop "Static Text" object to Page Header.
Similarly, drag & drop second "Static Text" object to Page Header.
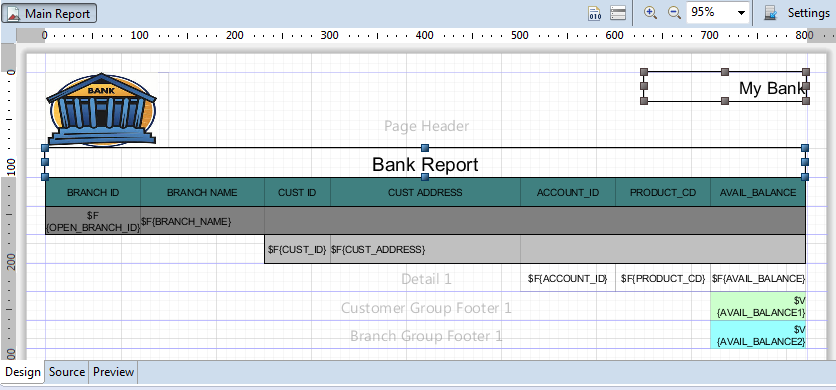
Run Report (Third time)
